A Tale of Two Lineups
The chart below reveals the stark contrast in Juan Soto’s performance. In late 2024, with Aaron Judge behind him in the Yankees lineup (blue line), Soto’s 10-game rolling hit average soared. In early 2025, with the Mets and no Judge (orange line), it plummeted.
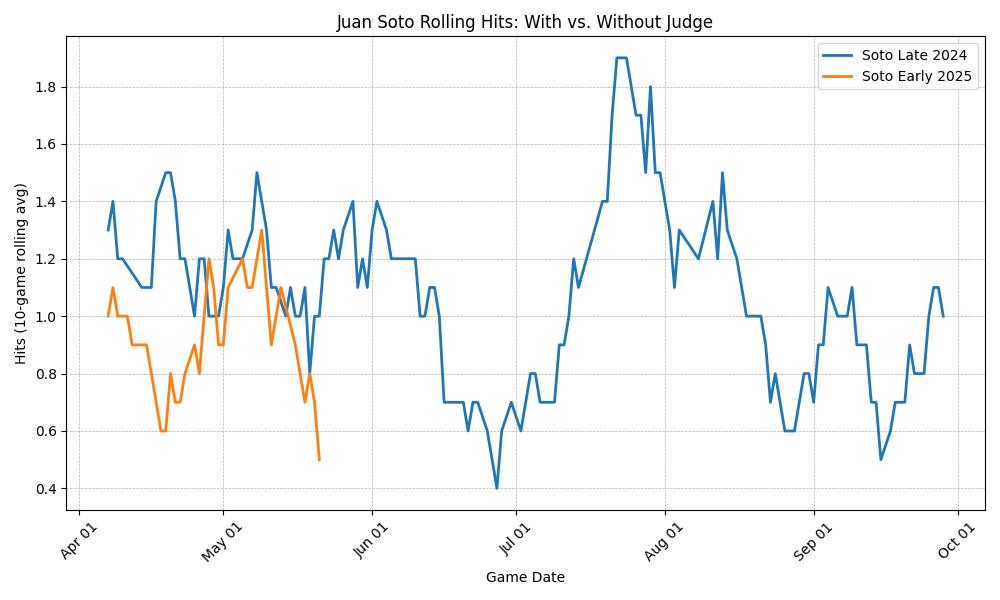
Figure: Soto’s rolling hits per game. Blue = Yankees (with Judge). Orange = Mets (no Judge).
What It Means
This isn’t about Soto losing his skill—it’s about strategy. With Judge on deck, pitchers threw more strikes, giving Soto better pitches to hit. Without Judge, pitchers could afford to be cautious, dodging Soto with walks or off-speed pitches.
The graph screams one truth: lineup protection matters. The Soto–Judge Effect is real, and it’s measurable.